This is the second instalment of my blog feature on Beginners Guide to Business Intelligence. This time I am looking at: What is a Data Warehouse exactly?
Business Intelligence Context
First Business Intelligence in my opinion is not just architecture. It is a strategy of information within an organization. All organizations report on the performance of their business processes, services and sales. How they manage and organize information is maintained by a Business Intelligence Architecture, which is made up of several components. A data warehouse is just one such component. The data warehouse is sometimes seen as the corporate repository.
Before we get into the detail of data warehouse definitions lets have a flash back for a bit of data warehouse history.
Birth of Data warehousing
In a sense, companies have been reporting on information since the dawn of computing systems. Data warehousing is really a collection of technologies that have evolved within information systems. Listed below are some of the legacy terms that you may come across when talking about data warehouses.
Executive Information System (EIS)
One of the first attempts at giving executive managers a high level view of business activities, this kind of system was widely adopted in the late 70s and early 80s. Usually these systems would be summary tables built on top of transactional tables. EIS focused solely on the financial view of the organisation with limited information other than budget vs. actual. The tables would be maintained within the source system and loaded once a month and reports would be generated on top of them, almost always printed on line-flow paper.
Management Information System (MIS)
An extension of EIS, the MIS gave business users a wider view of information in the form of Balance Scorecards and other summarised views of information. The term Key Performance Indicators (KPI) was widely adopted for measures that were just not financial based. For the first time summary tables would be maintained independently of the transactional source system. This kind of system was widely adopted in the late 80’s early 90’s. In fact entire departments were named after MIS systems, hence the term MIS Department.
Decision Support Systems (DSS)
The next evolutionary step was the creation of the DSS. A term widely used when discussing OLAP solutions. In the 90’s you were more than likely building a DSS system to support OLAP reporting. This was the era of creating reporting systems for areas of the business no longer just focusing on Financial and Sales reporting. It has to be noted that if is was not for products like Essbase, Cognos and front-end tools like Lotus 1-2-3 and Microsoft Excel; DSS systems may not have been so successful. It was the first time that information was delivered to operational roles outside of transactional systems.
Data Warehouse
The data warehouse really is a central repository combining all of these earlier systems. The early data warehouses were third normal form 3NF databases, taking incredible amounts of time to develop. Due to the large nature of early data warehouse, data integration was heavily used in the creation of data warehouses, requiring special ETL (Extract, Transform, and Load) tools and skills - even worse to develop and create reports against. At this time two distinct trains of thought appeared when it came to defining what a data warehouse should be.
The first general definition was that the existing third normal form system, was the only solution to the eternal business questions that a drive a company. Bill Inmon was the main proponent of this concept stating that data warehouse architects could never predict all possible business questions just using summary tables alone. A data warehouse by its very definition should store data at the lowest level possible providing an Ad-hoc query environment. This created the need to store large amounts of data in a structure, which could never be fully tuned for all possible queries.
Many organisations had invested heavily in a data warehouse without fully realizing all the potential benefits. The original goals of data warehouse systems were to create an environment with the easy access, and usability too large amounts of data. Early data warehouses were too complex in nature and as a result fell well short of this goal.
Something had to change.
That happened to be Ralph Kimball and the concept of de-normalisation. Ralph proposed an ingenious way of data retrieval using existing RBMS systems. The main idea was to create low level transactional (facts) tables with attribute (Dimensions) tables relating to each transaction using an integer surrogate key system.
This allowed the database optimizers to summarize large amounts of data more efficiently. Due to the reduction in the number of tables required for a similar query in a traditional data warehouse. This definition describes the Star schema concept from a high-level technical view. Besides the query performance improvement there was a huge business benefit, for the first time business users had a view of data from an information context.
Another benefit of Star schemas was the business context or subject area. Business users were presented a view of transactional data from a business context. Instead of having to join multiple tables with complex joins to produce a query that only DBAs understood. Users where able to write queries that answered business questions for example, how many products did the company sell for this year compared to last year?
Third Normal Form vs. Star schemas
Kimball vs. Inmon is the most common discussion between Data Warehouse Architects, next to which database engine is the best for data warehousing, It maybe one of the few arguments that will never truly die down.
Proponents of 3NF push the robust nature of data warehouses as the corporate repository/information factory that will move with the business and insulate against change with in source systems.
On the other hand Star schemas provide a high performance user friendly reporting environment, which is the ultimate goal of any data warehouse. Even within the star schema approach there are differing views on whether the star should be snowflake (Relational dimensions with de-normalized fact table) or just solely the de-normalized.
The Next Step: Data Marts
Data warehouses became victims of their own success. Organisations started to realize the benefits but could not wait necessarily for a large system to be put in place, hence the data mart.
Although data warehouses were and still are a successful approach to the corporate data repository, the length of time, cost and complexity to develop and deliver data warehouse projects reduce some of the benefits. This was due to the fact that most organizations would change during the course of long projects.
A data mart tends not to suffer from such issues. As the data mart is a focused repository on one area of the business. Organisations are able to see a quick turn around and delivery of a high value repository that a data mart has to offer.
The most common form of a data warehouse will more than likely be a collection of data marts. This is sometimes called a federated data warehouse. Often this is the most successful form of data warehousing.
No matter what kind of system you are building the goals always the same: the delivery of information. Ultimately this kind of system undertaking should always support the business decision making process.
References
Want to know more about Data Warehouses? Check out the following references:
Bill Inmon http://www.inmongif.com/
Ralph Kimball http://www.ralphkimball.com/
Great Resources and Articles about Data Warehousing:
http://www.intelligententerprise.com/
http://www.DMReview.com/
Beginners Guide to Business Intelligence: What is Business Intelligence About?
What is Business Intelligence About?
Showing posts with label BI Articles. Show all posts
Showing posts with label BI Articles. Show all posts
Monday, March 13, 2006
Tuesday, December 06, 2005
Report Builder and the UDM
This month is definitely Report Front end development month. After presenting at our cabana session at SQL Server 2005 launch I have been getting busy with Report Builder and Reporting Services 2005. The project I am working on is a small scale reporting solution.
The UDM
At first I had a good look at using Analysis Services as my main repository for storing all my business logic and handling querying against the source system. This has its advantages; it reduces the load against the source system and offers high performance.
The main disadvantage was the complexity of getting data out of an OLAP solution. Of course it is easy with RS 2005 now, but the navigation across the OLAP cube can be a bit daunting to a novice business user.
Report Builder
Then there is Report Builder. Now there is something, an easy to use interface to create reports against any SQL Server/Analysis Services data source. The report writing is done via a report model. The model removes the need to create queries that require knowledge of the data source. This is great for users that don’t want/know how to join tables.
There is a gap in Report builder when it comes to complex reports. Report builder is a limited report designer allowing users to create reports in a controlled interface. For complex reports I always go for Report Designer. There is a not so well document feature that allows you to create Visual Studio Report Designer reports against a report model.
Russell Christopher wrote a neat little piece on using a report model as a data source. Check out: Using a Report Builder Model as a Report Designer data source in SQL 2005
How about both Report Builder and Analysis services?
The best solution is using a combination of Analysis Service cubes and Report Builder to provide an easy access way for users to reports. Using this hybrid approach will enable high performance query and reporting response times with user interface that’s not a pivot table.
It is a challenge to create a Report Model based on Analysis Services. The quickest way is creating a shared data source in reporting services. Follow these steps:
Mark Russo has also blogged on creating a report model against Analysis services in BI Studio. Check out: Report Builder Model with UDM
The UDM
At first I had a good look at using Analysis Services as my main repository for storing all my business logic and handling querying against the source system. This has its advantages; it reduces the load against the source system and offers high performance.
The main disadvantage was the complexity of getting data out of an OLAP solution. Of course it is easy with RS 2005 now, but the navigation across the OLAP cube can be a bit daunting to a novice business user.
Report Builder
Then there is Report Builder. Now there is something, an easy to use interface to create reports against any SQL Server/Analysis Services data source. The report writing is done via a report model. The model removes the need to create queries that require knowledge of the data source. This is great for users that don’t want/know how to join tables.
There is a gap in Report builder when it comes to complex reports. Report builder is a limited report designer allowing users to create reports in a controlled interface. For complex reports I always go for Report Designer. There is a not so well document feature that allows you to create Visual Studio Report Designer reports against a report model.
Russell Christopher wrote a neat little piece on using a report model as a data source. Check out: Using a Report Builder Model as a Report Designer data source in SQL 2005
How about both Report Builder and Analysis services?
The best solution is using a combination of Analysis Service cubes and Report Builder to provide an easy access way for users to reports. Using this hybrid approach will enable high performance query and reporting response times with user interface that’s not a pivot table.
It is a challenge to create a Report Model based on Analysis Services. The quickest way is creating a shared data source in reporting services. Follow these steps:
- Select the shared data source in report manager
- Click on Generate model button
- Enter a Model Name, Description and Location Click ‘Ok’
- Open Report Builder and select your new model.

Mark Russo has also blogged on creating a report model against Analysis services in BI Studio. Check out: Report Builder Model with UDM
Sunday, October 23, 2005
My Top 10 SQL 2005 Features for RTM
Hello All,
This post is all about the top ten features I am looking forward to in SQL Server 2005. You may be surprised it’s not just SSIS nor is it just about reporting services.
1. SQL 2005 RDBMS: There have been some huge improvements in the core database engine. The two major areas of improvement that bring this area as number one are: Query Performance and Disaster Recovery. These two features I will use on every project. Listed below is functionality in detail that made up the number one ranking.
Control/Data Flow: One of the first features that most DTS developers will notice when using integration services. The control of flow allows developers to seprate workflow from transfromation tasks. Transfroming with DTS 2000 was a read once write once operation. Data flow allows you to read data in and transform multiple times(read once write mutlipule operations). This reduces disk I/O but ultimately requires more memory. This results in a huge performance gain with reduction of disk operations. Check out:BOL: Integration Services Programming
Fuzzy Lookups: Data quality affects every data warehouse project. A new transformation called fuzzy lookups is a tool to help address this problem. The functionality allows you to apply some data mining techniques to profile data that would normally fail on load.
Slowly Changing Dimensions Transformation: OK why did I not rank this features number one. By far this is one of the cooler features in integration services. This transformation allows you to handle type I and type II slowly changing dimensions. This is one of the things I’ve had to create my own architecture in SQL server 2000 to handle. Check out :BOL: Slowly Changing Dimension Transformation
Loops: What can I say all of us have wanted to do loops with DTS 2000, it is now standard feature with an integration services. The best example of this is looping through a set of text files and loading them with one data transformation.
9. User Interfaces: Ok it’s a bit lame but the complete refresh of the UI was required. And this time someone listen to us developers and created an integrated workbench for the development of business intelligence projects. The old user interfaces have been replaced by two new applications, the SQL server management studio and business intelligence development studio.
This post is all about the top ten features I am looking forward to in SQL Server 2005. You may be surprised it’s not just SSIS nor is it just about reporting services.
1. SQL 2005 RDBMS: There have been some huge improvements in the core database engine. The two major areas of improvement that bring this area as number one are: Query Performance and Disaster Recovery. These two features I will use on every project. Listed below is functionality in detail that made up the number one ranking.
- Query Performance: There are two areas that have improved query performance, Covering Indexes and Partition tables. The major change is in covering indexes. They can have more than 16 columns as long as the total number of page bytes (8k) is not exceeded. This is great for fact tables with a large number of dimension keys that need to be indexed. Partition tables are the other feature that makes a difference to query performance on large tables. This feature not only allows the partitioning of data but indexes as well. Check out: SQL Server 2005: Two Little Known Features That Matter Big! and BOL: Index with Included Columns and also have a look at BOL: Designing Partitioned Tables and Indexes
- Disaster Recovery: The Backup and Recovery have been improved in this release. The best new feature is the Online restore. Allowing User access to the database once the redo logs have start. This is an awesome feature allowing the restore time to be reduced significantly. For more info check out BOL: Performing Online Restores
- Deployment of Analysis Services Cubes: The new ASSL scripting allows for creation and maintenance of Analysis Services Databases and Cubes. Check out BOL: Analysis Services Scripting Language (ASSL)
- Performance Enhancements: Analysis services is fast becoming the reporting back end for high performance reporting. Features such as Proactive Caching, and the improvement in storage models allows users a fast query response against OLAP and Relational data sources.
- Analysis Enhancements: There are several key enhancements in the area of analysis. Key performance indicators (KPI), are now stored within the OLAP cube. Drill through has been enhanced and translations have been created to help developers with international users.
- Dimension: One of the limitations that I continue to struggle with in AS2000 is the use of member properties to extend dimension usability. Of course this has been addressed in AS2005. No longer are dimensions based on hierarchies instead they are based on attributes. In line with most reporting requirements. Hierarchies are instead based on attributes.
- UDM (AS2005 OLAP Cube): One of my biggest gripes with AS2000 was the inability to handle mixed grain cubes. Generally relating to the multiple fact tables within one cube requirement. Of course we could use virtual cubes to create the big super cube solving this issue. In the case of AS2005 this is no longer an issue. Through the use of measure groups we are able to handle multiple fact tables with different grains. This is further enhanced by dimensions being allowed to handle many to many relationships with fact tables.
3. Reporting Services: RS2005 is jam packed with new features that just makes it better to write reports than the last release. New controls have been enabled for multi parameter selection. Calendars controls for selecting date parameters, and of course direct printing. Listed below is functionality in detail that made up of number three ranking.
- Multi Parameters: One of the missing features in RS2000 was the ability to select multiple values in a list. This has been resolved in RS2005 with a check box list option for parameter selection.
- Calendar Control: One of my favourite features in this release. This is automatically enabled as long as your parameter is of a data type “Datetime”. The control will automatically appear when viewing reports.
- Direct Printing: The printing functionality in reporting services has been greatly enhanced. ActiveX control has been created to enable printing from within the browser.
- MDX Query Designer: Ever had to create a report against an OLAP cube in RS2000? It was not pretty as you had to create MDX statements manually. RS2005 provides you with a query builder for MDX.
4. Report Builder: This is the first attempt by Microsoft to enable report users to create reports from relational database sources and not just an OLAP cube. Report builder was a product called ActiveViews that was purchased by Microsoft sometime ago (See: Microsoft Adds ActiveViews to Free SQL Reporting Services Add-On). This is the first version from Microsoft and currently only supports SQL Server and Analysis Services. This was the product that I really enjoyed presenting at Tech05. It is a great product for the report users to create reports without having to understand the underlying database structure. For an overview Check out BOL: Working with Ad Hoc Reports using Report Models
Listed below is functionality in detail that made up of number four ranking.
- Report Models: The major component of the report builder is a business model that allows report users to create reports. This is the central repositiry for creating: common business calculations, Drillthrough paths and complex queries. Just like integration services and analysis services, report models are based on a data source views. You are able to hide database complexity by creating made queries for complex joins and data source calculations.
- Ad hoc Reporting: Once a report model been created and published. Any user can navigate the underlying RDBMS without having to join any tables. It’s a great tool for reducing the complexity of creating reports. Reports can take three forms cross tab, table, and my favourite charts. All reports are published to the report manager portal. If the report model supports Drillthrough functionality users are able to navigate the data model.
- Report Manager: Drillthrough functionality is one of the best things this happened to reports in reporting services. Report builder reports also support floating table headings. With scrollable headings large reports can be displayed in the browser in a greatly improved format.
5. Integration Services: I liked DTS, but I really love integration services. This should really have a top ten feature list of its own. Perhaps I will have to do one after this blog. The key feature I’m really interested in are around reusability of data in the data pipe. Its a great feature and one of the biggest changes. Other features include Fuzzy Lookups, Slowly Changing Dimensions Transformation, Loops, the list goes on. Listed below is functionality in detail that made up of number five ranking.
6. Data Mining: Seven Data mining Algorithms! OK hands up who has done data mining with AS2000? I myself have only done it on three projects. The biggest limitation with data mining in 2000 was a lack of a work bench to test your mining hypothesis. Then if you want to display the results you had a limited number of display options. Needless to say data mining has been greatly improved in this release. Microsoft research has continued their quest in the development of new algorithms for us to use. The two algorithms provided in SQL server 2000 have been greatly improved. If the statue with data mining to have this tutorial for books online: BOL: Creating a Forecasting Mining Model Structure (Data Mining Tutorial)
7. T-SQL: New SQL functions - finally I can rank. T-SQL has been approved with inclusion of new features such as CLR support, and new text Data types. Check out: BOL: Transact-SQL Data Types
- Rank(): I can honestly say I have need something like this for a long time. With this function I can rank my results with a rank number. I can even rank with a partition of the result set. Check this out if you use Reporting Services and need to rank the results I bet you will use this function. See: BOL: RANK (Transact-SQL)
- Replacement text data types: The search limitations of using text and ntext was handled by using the full text search engine. Two new data types have been created varchar(Max) and nvarchar(Max). The new data types can be used to in the where clause is standard conditions.
- XML data type: XML is now treated with its own data type. The new data type fully supports XQuery. See: XQuery Against the xml Data Type
9. User Interfaces: Ok it’s a bit lame but the complete refresh of the UI was required. And this time someone listen to us developers and created an integrated workbench for the development of business intelligence projects. The old user interfaces have been replaced by two new applications, the SQL server management studio and business intelligence development studio.
- SQL Server Management Studio: a cross between the old enterprise manager and query analyzer. To it as a single point for managing all server instances this includes Reporting Services, Analysis Services and Integration Services. Management studio is also the main query engine for SQL server.
- Business Intelligence Development Studio: fully integrated into visual studio 2005, developers are able to create end to end business intelligence solutions. This a single point for developing integrated services, reporting services, and analysis services projects.
10. Upgrade Advisor: Need to upgrade? Check out your current SQL server 2000 instance before installation. The first step should be the upgrade adviser. This can be found on the installation CD and is not installed by default and can be run independently of SQL server 2005 applications. It requires .Net framework version 2.0. You may wish to migrate instead of upgrading; SQL Server 2005 can be run as a side by side installation with 2000.
To download the CTP version of Upgrade Advisor check out: Upgrade Advisor - Community Technology Preview (CTP) September 2005
This list is based on the September CTP so it’s missing DB Mirroring which was in my top ten. I haven’t begun to talk about the new BI products such as the new scorecard accelerator that will have to be in another post.
What are you’re top ten features you’re looking forward too in SQL 2005?
Don’t be shy feel free to leave a comment as I have enabled anonymous user comments.
Wednesday, September 07, 2005
Introduction to the Unified Dimensional Model (UDM)
I was talking to a colleague about Analysis Services and how awesome the Unified Dimensional Model (UDM) is. I then realized I have not blogged in ages about anything useful. So I have pulled together some of my thoughts about the UDM.
I was really introduced to the UDM on the Yukon Ascend program last year in Sydney. At the time I was still trying to find out what the UDM was in Analysis Services 2005 (AS2005). The simple answer is “The UDM is a Cube in AS2005”. Ok that may be glossing over the UDM a bit, but you will not find the UDM in AS 2005. There is no CREATE UDM function in AS2005. An AS2005 cube ties all the UDM features together.
The UDM, I mean cubes provide the ability for reports (OLAP, Reporting Services) to be generated against standard OLAP cubes as well as Relational data sources. Queries can be optimized to either run against aggregates from OLAP storage or directly against the relational data sources offering a high performance reporting environment. Reporting services has been extended too with a UI to create MDX queries (something that was sorely missing in SQL 2000).
The feature list for the UDM is huge. Data mining has been extended in AS2005 with seven algorithms. New KPI functionality has also been introduced in this release. The list goes on. I have put together some Useful links to UDM and Analysis Services 2005 resources.
Introduction to the UDM
http://msdn.microsoft.com/library/default.asp?url=/library/en-us/dnsql90/html/IntrotoUDM.asp
Analysis Services 2005 Processing Architecture
http://msdn.microsoft.com/library/default.asp?url=/library/en-us/dnsql90/html/sql2k5_asprocarch.asp
Enabling Drillthrough in Analysis Services 2005
http://msdn.microsoft.com/library/default.asp?url=/library/en-us/dnsql90/html/sql2k5_anservdrill.asp
Introduction to Data Mining
http://www.microsoft.com/technet/prodtechnol/sql/2005/intro2dm.mspx
SQL Server 2005 Reporting Services (SSRS)
http://www.microsoft.com/technet/prodtechnol/sql/2005/2005ssrs.mspx
I have started my research in earnest into how I am going to use the UDM on Business Intelligence projects. I hope this is a good start for any one looking at the UDM.
\Myles.
Tuesday, August 23, 2005
Beginners Guide to Business Intelligence: What is Business Intelligence About?
I have decided to do a beginners guide to BI on my blog. I thought this would be a great way to tie all the resources I use and give you a good idea for an approach to BI projects. I am starting off with a question that needs to be answered.
What is Business Intelligence About? Decisions of Course
I often find myself in situations where I have to try and explain Business Intelligence. It’s not that easy to define BI in a universal definition that everyone agrees with. BI is as much a collection of technologies and principles as anything else.
So here it goes,
‘Business Intelligence is about taking the guess work out of the decision making process.’
That’s right it’s not about technology or a wonderful new process. It’s about the management decision making process that occurs in every business. To demonstrate this in more detail lets review what the Management Decision Making Process (MDMP) is about.
The MDMP was introduced to me on my first data warehousing project by Peter Nolan the architect of the project. He took me through the concept of why you want to start a BI project in the first place. He posed a simple question, ‘How is Business?’
There are four primary drivers that make up a cycle that form the MDMP. Consider each factor as deliverables forming a BI platform. The diagram below shows four primary drivers for the MDMP.
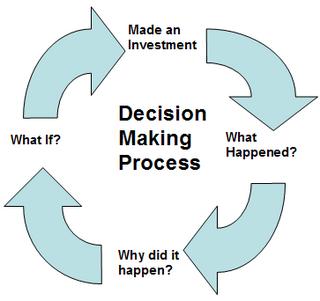
Made an Investment – Every organization makes an investment either in a product or a service. The tracking of the investment is the first driver in the MDMP. For example a product stock keeping or a resource schedule report allows a compony to track its resources.
What Happened? – The second driver covers the result of the investment. Did the investment payoff, did we make a sale? For example a sales report allows business to track the success of the investments.
Why did it happen? – The third driver is to analyse the success of the investment. Organizations use OLAP analysis Ad-hoc reporting to drill down to the reasons for the performance.
What if? – The fourth and final driver and the most difficult to implement. Organizations are constantly looking for new opportunities to invest, questions like; what is the impact of further investment? What if we gave 10% further discount? Looking for new opportunities with data mining and forecasting techniques helps answer this question.
So how do you deliver MDMP?
When starting a BI project you must set firm goals around the end deliverables. A great place to start is taking a single business process and mapping to the MDMP. (Selecting a business process is an entirely different subject for a blog.)
Once a process has been selected a solid business case been derived using the MDMP. The four primary drivers of MDMP will allow you to set clear goals for delivery that the business can understand.
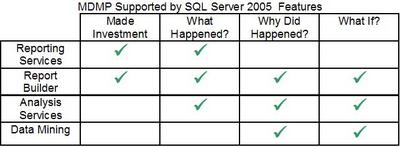
SQL Server 2005 vs. MDMP
Reviewing the SQL Server 2005 product against MDMP shows how much BI functionality Microsoft has release in the version. Below is a table showing the reporting functionality SQL Server 2005 has built into support the MDMP.
Conclusion
Basing your BI project on the MDMP you have a common point of view across the business and technology requirements are key to delivering a successful project. For further information on the MDMP check out the resources below.
Resources
Getting Started and Finishing Well By Peter Nolan
http://www.intelligententerprise.com/010507/print/webhouse.htm
Where is Peter?
http://www.peternolan.com/
Beginners Guide to Business Intelligence: What is a Data Warehouse?
Monday, August 01, 2005
News Group Post: Slowly Changing Dimensions Type 2
Note: This is a response to a news group posting. Due to formatting problems I have reposted the response on my Blog. Don't worry I don’t intend this again.
Rico asks how I can implement type 2 changes in a dimension.
Hello Rico,
Type 2 is relatively easy to implement, but it can be a pain for users to understand and use.
Implementing Type 2
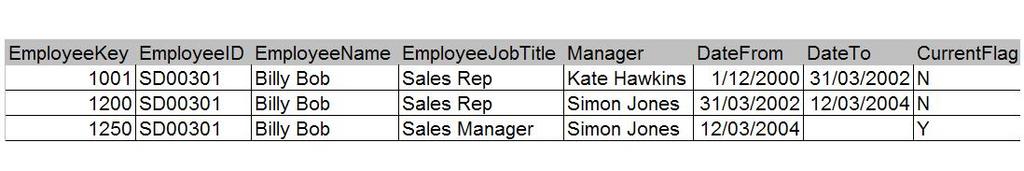
Generally I use a set of standard flags to track the changes in the dimension. Each flag is used to determine the state of the record. I am assuming that you are using Surrogate keys in your dimensions and Fact tables.
Date From – The date the record arrived in the dimension
Date To – The date the record is deemed to be changed
Current Flag – The State of the record Y or N
With these flags you can track changes of the dimension at the lowest level such as employee changes.
e.g.
Employee Dimension
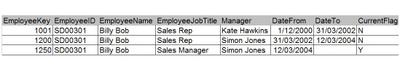
You will have to come up with at change capture process. If you have type 1 deployed already it would be the same logic for identifying the changes, with the exception of updating old records and a creating new records in the dimension. Remember you will have to update your surrogate key lookup in you fact table build to load with the current dimension record. I.E. “WHERE Current Flag =’Y’ ”
Implementing Type 2 without Flags
To be honest I have not tried this method but it worth considering if your Business users have problems reporting using the Type 2 Flags. Rather than having one Employee Dimension create a series of mini dimensions against the fact table. This would allow you to track changes against the fact record instead of the Dimension.
E.G.
Employee Dim is broken into three new dimensions (Dim Manager, Dim Employee, and Dim Job Title) as shown in the diagrams below

There is a HUGE draw back to this you end up a large amount of dimensions and a really wide fact table if you have to include a lot of them.
Hope this gets you started.
Myles Matheson
Data Warehouse Architect
http://bi-on-sql-server.blogspot.com/
Rico asks how I can implement type 2 changes in a dimension.
Hello Rico,
Type 2 is relatively easy to implement, but it can be a pain for users to understand and use.
Implementing Type 2
Generally I use a set of standard flags to track the changes in the dimension. Each flag is used to determine the state of the record. I am assuming that you are using Surrogate keys in your dimensions and Fact tables.
Date From – The date the record arrived in the dimension
Date To – The date the record is deemed to be changed
Current Flag – The State of the record Y or N
With these flags you can track changes of the dimension at the lowest level such as employee changes.
e.g.
Employee Dimension
You will have to come up with at change capture process. If you have type 1 deployed already it would be the same logic for identifying the changes, with the exception of updating old records and a creating new records in the dimension. Remember you will have to update your surrogate key lookup in you fact table build to load with the current dimension record. I.E. “WHERE Current Flag =’Y’ ”
Implementing Type 2 without Flags
To be honest I have not tried this method but it worth considering if your Business users have problems reporting using the Type 2 Flags. Rather than having one Employee Dimension create a series of mini dimensions against the fact table. This would allow you to track changes against the fact record instead of the Dimension.
E.G.
Employee Dim is broken into three new dimensions (Dim Manager, Dim Employee, and Dim Job Title) as shown in the diagrams below
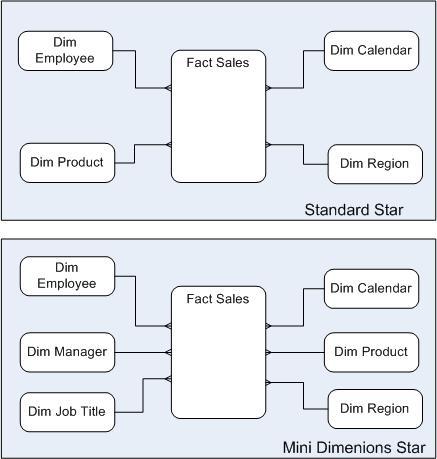
There is a HUGE draw back to this you end up a large amount of dimensions and a really wide fact table if you have to include a lot of them.
Hope this gets you started.
Myles Matheson
Data Warehouse Architect
http://bi-on-sql-server.blogspot.com/
Subscribe to:
Posts (Atom)